Estonia Life Insurance Market Expected to Reach at a CAGR of 13.6% by 2017

2013-07-02
Published : Jul-2013

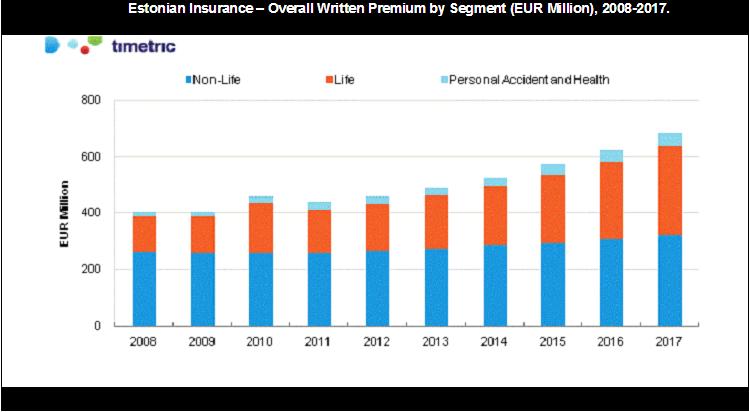
The Estonian life insurance segment grew at a CAGR of 7.6% between 2008 and 2012, driven by an aging population and demand for investment linked products. The aging population drove consumer attention towards post retirement savings. This is expected to remain the growth driver for life insurance over the next 5 years, during which time the segment is expected to expand at a CAGR of 13.6%.

Life insurance in Estonia is predominantly distributed through the e-commerce and direct marketing channels. In terms of written premium for new business in 2012, e-commerce accounted for the largest market share of 65.8%, followed by direct marketing with 16.2%. The value of the Estonian life insurance segment has grown continuously over the last 5 years and is expected to reach a projected value of EUR313.2 million (US$436.2 million) in 2017, as a result of the growing economy, aging population and growing consumer awareness of the importance of life insurance.

Complete Report Copy@ http://www.rnrmarketresearch.com/life-insurance-in-estonia-key-trends-and-opportunities-to-2017-market-report.html

The European debt crisis had an adverse effect on demand for investment linked life insurance products in Estonia. This, in turn, led to a decline in the country’s life insurance segment. However, following a recovery in the economy, demand for investment linked life insurance products improved in 2012, resulting in the overall life insurance segment registering a growth rate of 8.0%. The Estonian GDP at current prices is expected to increase at an average rate of 6% over the next 5 years. Such growth in the GDP is expected to drive Estonian consumers towards investment linked life insurance products.

The aging population of Estonia is a major driving force for life insurance products in the country. The increase in life expectancy from 75.4 years in 2010 to 76.5 years in 2011 encouraged more people to take out guaranteed return life insurance products such as pensions.

Order / Buy a Report Copy @ http://www.rnrmarketresearch.com/contacts/purchase?rname=104927

Target audience

– Insurance companies

– Suppliers to insurance companies.

– Contractor research organizations

– Trade body, academia or other industry observers

– Companies involved at any stage in the manufacturing, procurement and marketing process

– Marketing and advertising agencies

Reasons to buy

– Realize the growth potential and attractiveness in the Estonian Life Insurance industry through means of Timetric’s analysis and outlook’s.

– Gain a better understanding of the industry by reviewing analysis of the key industry trends and drivers.

– Plan for the future by understanding the current business environment and country risk.

Explore More Reports @ http://www.rnrmarketresearch.com/reports/business-financial-services/financial-services/insurance-financial-services/lifeinsurance

Table of Content

8 Reinsurance Growth Dynamics and Challenges
8.1 Reinsurance Segment Size, 2008-2017
8.2 Reinsurance Segment Size by Insurance Segment, 2008-2017

9 Competitive Landscape and Strategic Insights
9.1 Overview
9.2 Leading Companies in the Estonian Life Insurance Segment
9.3 Swedbank Life Insurance SE – Company Overview
9.3.1 Swedbank Life Insurance SE – key facts
9.3.2 Swedbank Life Insurance SE – key financials
9.4 Compensa Life Vienna Insurance Group SE – Company Overview
9.4.1 Compensa Life Vienna Insurance Group SE – key facts
9.4.2 Compensa Life Vienna Insurance Group SE – key financials
9.5 SEB Elu- ja Pensionikindlustus – Company Overview
9.5.1 SEB Elu- ja Pensionikindlustus – key facts
9.5.2 SEB Elu- ja Pensionikindlustus – key financials
9.6 Mandatum Life Insurance Baltic SE – Company Overview
9.6.1 Mandatum Life Insurance Baltic SE – key facts
9.6.2 Mandatum Life Insurance Baltic SE – key financials

10 Business Environment and Country Risk
10.1 Business Confidence
10.1.1 Market capitalization trend – Tallinn Stock Exchange, Estonia
10.2 Economic Performance
10.2.1 GDP at constant prices (US$)
10.2.2 GDP per capita at constant prices (US$)
10.2.3 GDP at current prices (US$)
10.2.4 GDP per capita at current prices (US$)
10.2.5 GDP by key segments
10.2.6 Agriculture, hunting, forestry, fishing net output at current prices (EUR)
10.2.7 Agriculture, hunting, forestry, fishing net output at current prices (US$)
10.2.8 Agriculture, hunting, forestry, fishing net output at current prices as a percentage of GDP
10.2.9 Manufacturing net output at current prices (EUR)
10.2.10 Manufacturing net output at current prices (US$)
10.2.11 Manufacturing net output at current prices as a percentage of GDP
10.2.12 Mining, manufacturing and utilities net output at current prices (EUR)
10.2.13 Mining, manufacturing and utilities at current prices (US$)
10.2.14 Mining, manufacturing and utilities at current prices as a percentage of GDP
10.2.15 Construction net output at current prices (EUR)
10.2.16 Construction net output at current prices (US$)
10.2.17 Construction net output at current prices as a percentage of GDP
10.2.18 Inflation rate
10.2.19 Exports as a percentage of GDP
10.2.20 Imports as a percentage of GDP
10.2.21 Exports growth
10.2.22 Imports growth
10.2.23 Annual average exchange rate EUR-US$
10.3 Infrastructure Quality and Availability
10.3.1 Commercial vehicles exports total value
10.3.2 Commercial vehicles imports total value
10.3.3 Automotive exports total value
10.3.4 Automotive imports total value
10.3.5 Total internet subscribers
10.4 Labor Force
10.4.1 Labor force
10.4.2 Unemployment rate
10.5 Demographics
10.5.1 Gross national disposable income (US$)
10.5.2 Total population
10.5.3 Urban and rural population
10.5.4 Age distribution of the total population

Filed in: Banking & Finance, Insurance
More Reports
Title Price Buy Now

Payment Processing Solutions Market by Payment Method (Debit Card, Credit Card, eWallets, ACH), Deployment Type (On-premises, Cloud-based), Vertical (BFSI, Government and Utilities, Telecom and IT, Healthcare) and Region – Global Forecast to 2027

MarketsandMarkets forecasts the payment processing solutions market size to grow from USD 90.9 billion in 2022 to USD 147.4 billion by 2027, at a Compound Annual Growth Rate (CAGR) of 10.1% during the forecast period. “By Payment method, the credit card record a larger market share during the forecast period” Credit card is a payment card issued to users , enabling the cardholder to pay a merchant for goods and services and other charges. A credit card enables consumers to build a continuing balance of debt, subject to interest being charged. A credit card typically involves a third-party entity that pays the seller and is reimbursed by the buyer. The banks and other financial institutes offer various credit cards, such as business, secured, prepaid, and digital cards. “By D......
$4950

Goldman Sachs Wealth Management – Competitor Profile

Goldman Sachs Wealth Management - Competitor Profile Summary This competitor profile provides a comprehensive analysis of Goldman Sachs' private banking and wealth management operations. It offers insight into the company's strategy and financial performance, including key data on assets under management. Customer targeting, service proposition, product innovation, and marketing activities are also covered. Goldman Sachs is one of the leading financial services companies globally, with a presence in 29 locations. It operates through four business divisions: Investment Banking, Global Markets, Asset Management, and Consumer and Wealth Management. Scope - In January 2020, Goldman Sachs introduced a new Consumer and Wealth Management division. Wealth Management was previously under Inves......
$1295

Israel PESTLE Insights – A Macroeconomic Outlook Report

Israel PESTLE Insights - A Macroeconomic Outlook Report Summary Financial intermediation, real estate and business activities contributed 32.9% to the gross value added (GVA) in 2020, followed by mining, manufacturing and utilities (14.2%) and transport, storage and communication (13.4%). According to GlobalData, the three sectors are forecast to grow by 5.9%, 2.2% and 5.4%, respectively, in 2021. Tel Aviv and Jerusalem accounted for 56.5% of the country's GDP and 59.7% of Israel's population in 2020 The overall TA 25 (Israeli Stock Exchange) index exhibited an upward trend over the past year. As of November 12, 2021, the TA index stood at 1,889.38, compared to 1,418.39 on November 12, 2020. Scope - The Infrastructure For Growth' program aims to invest ILS230 billion ($70 billion) in......
$500

AXA – Enterprise Tech Ecosystem Series

AXA - Enterprise Tech Ecosystem Series Summary AXA SA is a global insurance company offering both life and non-life insurance products. It offers life insurance and savings products such as individual life insurance, group life insurance, health and personal protection products, and individual and group savings retirement products. It also offers property and casualty insurance products such as motor, household, property, and general liability insurance, apart from retail banking products and services. AXA operates in six geographical segments namely France, Asia, Europe, AXA XL (the U.S.-based subsidiary of AXA offering insurance products to commercial establishments), transversal and central holdings and international, which comprises Africa, Latin America, and Middle East. The company......
$1495

Tenpay – Competitor Profile

Tenpay - Competitor Profile Summary Tenpay is the second-largest online payment platform in China, behind only Alipay. It was launched in 2005 by Tencent, China's leading internet company. Tenpay supports online, in-app, and in-store payments both in China and abroad. Tenpay users can make fund transfers to other users' Tenpay accounts or their bank accounts. Users can also make mortgage and credit card payments and can invest in various financial products. Tencent also owns popular social media platforms including QQ Messenger and WeChat; it has integrated payment services into these apps called QQ Wallet and WeChat Pay, allowing users to conduct payment transactions directly. Tenpay is concentrated mostly in China, although it has expanded its services to select international markets......
$350

Google Pay – Competitor Profile

Google Pay - Competitor Profile Summary Google Pay was launched in February 2018. The service was formed following the merger of Google's existing Google Wallet and Android Pay payment brands. The solution is accepted at millions of retail outlets globally and supports all of the major payment networks, including American Express, Mastercard, Visa, Discover (US only), Visa Electron (excluding the US), PayPal, and JCB (Japan and US only). It is supported by a host of major banks and credit unions in the US. Users can store details of multiple debit, credit, and prepaid cards on Google Pay, which can be used to make payments at merchant outlets. In addition to in-store payments, Google Pay allows consumers to make online payments, enabling users to shop on participating websites. In India......
$350

Alipay – Competitor Profile

Alipay - Competitor Profile Summary Launched in 2004, Alipay is the largest alternative payment service provider globally in terms of transaction value. It is a subsidiary of Ant Financial Services, which is controlled by Alibaba Group. Alipay allows users to make fund transfers as well as online, in-app, and in-store payments at home and abroad. It is the primary method of payment for Alibaba's online marketplaces, including AliExpress, Tmall, and Taobao. In FY2021 ended March 31, almost 70% of gross merchandise value in Alibaba's Chinese marketplaces was settled via Alipay. The solution has become mainstream in China and is used to make payments for everything from retail purchases to taxi fares and hospital costs. Alipay is accepted in more than 110 countries, allowing Chinese touri......
$350

Hong Kong Retail Banking Market to 2025 – Analyzing Mortgage, Deposit, Lending Market Trends, and Digital & Alternative Channel Preferences

Hong Kong Retail Banking Market to 2025 - Analyzing Mortgage, Deposit, Lending Market Trends, and Digital & Alternative Channel Preferences Summary The retail banking sector in Hong Kong has shown growth despite the recent impact of COVID-19. Residential mortgages and retail deposits recorded the highest compound annual growth rates (CAGRs) in the region, with the exception of China. Consumer credit lending showed a strong CAGR in personal loans, again only trailing the Chinese market. However, growth across credit cards was weaker as economic activity decreased due to the pandemic. The Hong Kong market has witnessed a triple threat over the last few years. Its economy entered a recession in 2017 as geopolitical forces such as the US-China trade war had effects on the territory. Domestic......
$5250

Guyana Insurance Industry – Key Trends and Opportunities to 2025

Guyana Insurance Industry - Key Trends and Opportunities to 2025 Summary GlobalData's 'Guyana Insurance Industry - Key Trends and Opportunities to 2025' report provides in-depth market analysis, information and insights into the Guyanese insurance industry. This report provides a detailed outlook by product category for the Guyanese insurance industry. It provides values for key performance indicators such as gross written premium, penetration, density and cession rates, during the review period (2016-2020) and forecast period (2020-2025). The report gives a comprehensive overview of Guyanese economy and demographic, covid-19 impact on the industry and provides detailed information on the competitive landscape in the country. The report brings together GlobalData's research, modeling......
$1450

Croatia PESTLE Insights – A Macroeconomic Outlook Report

Croatia PESTLE Insights - A Macroeconomic Outlook Report Summary Financial intermediation, real estate and business activities contributed 23.7% to the gross value added (GVA) in 2020, followed by wholesale, retail and hotels (16.8%) and transport, storage and communication (8.8%). The three sectors are forecast to grow by 6.4%, 7.3% and 3.1% respectively in 2021. Jadranska Hrvatska and Kontinentalna Hrvatska are the major regions in Croatia. Kontinentalna Hrvatska accounted for 70.06% of total GDP in 2019 and 66.3% of the total population in 2020. The CROBEX exhibited an upward trend from October 4, 2020, to October 4, 2021. Overall, the index increased by 25.8% from 1,608.8 on October 4, 2020, to 2,024.03 on October 4, 2021. Scope - Croatia has formulated the National Transport Dev......
$500
We use cookies to deliver the best possible experience on our website.
By continuing to use this site, or closing this box, you consent to our use of cookies. To learn more, visit our Privacy Policy